
Clients have the ability to choose the density of their project as either being Normal or Low.
Based on your selection, this can change the delivery time of the expected turnaround for the project.
Note: Airworks retains the ability to change the density based on the input data given.
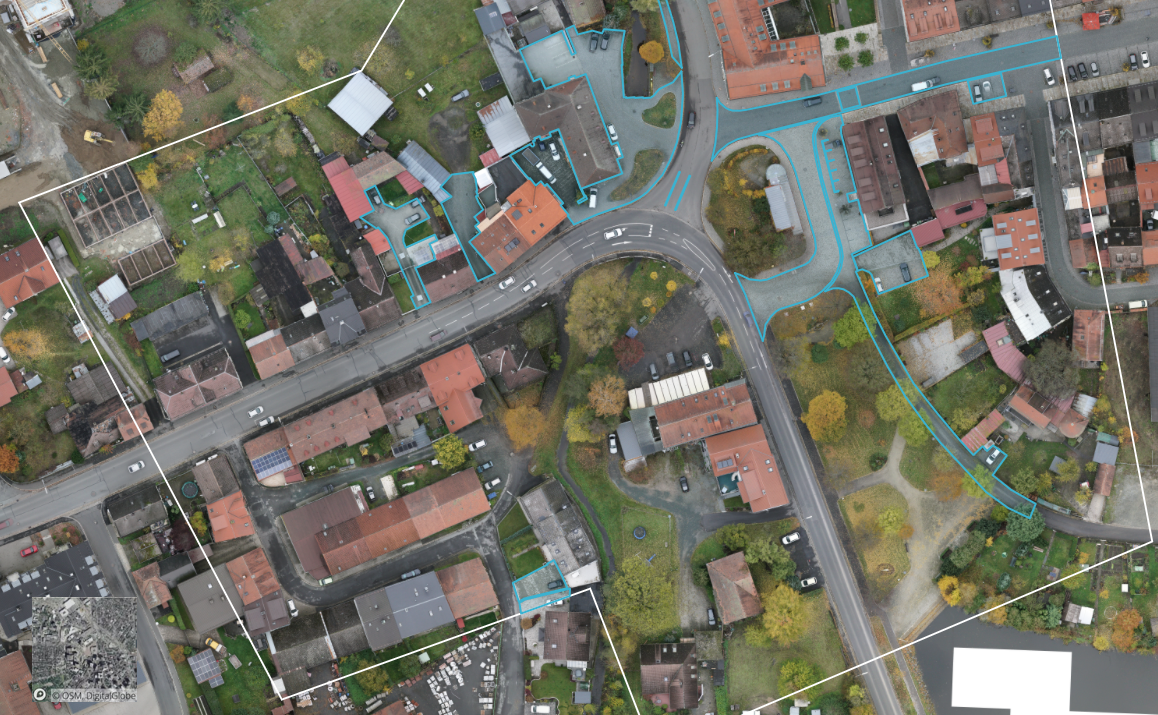
Below we will outline some examples of normal vs low density to showcase how a customer should identify their project. If for instance the Airworks team classifies the density as different than the customer then there will be an email triggered to let the client know of the change and how many acres have been charged to your order, and any change to the delivery date.
Normal Density Site Examples
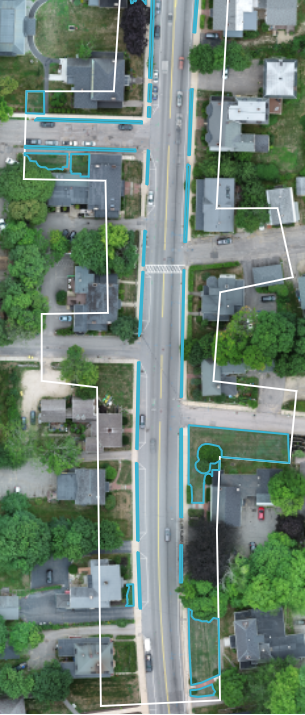
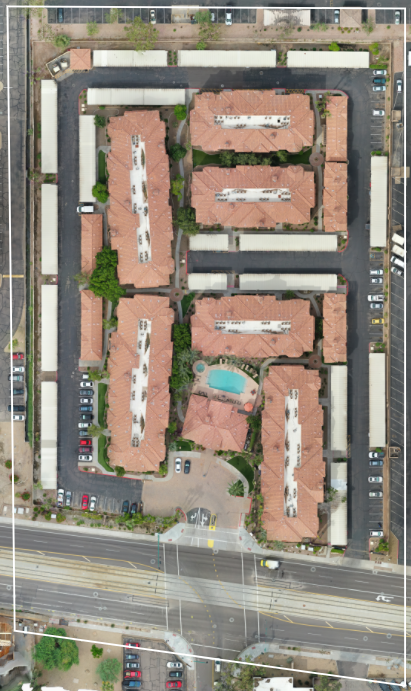
Low Density Site Examples
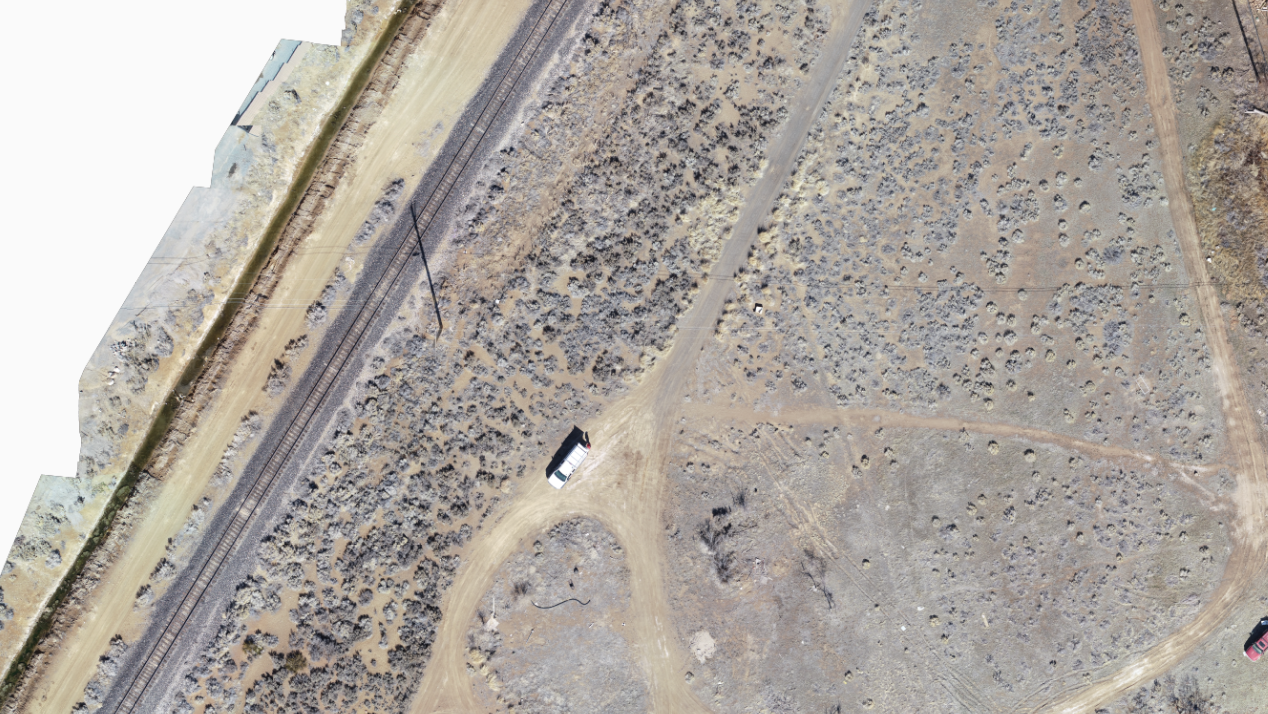
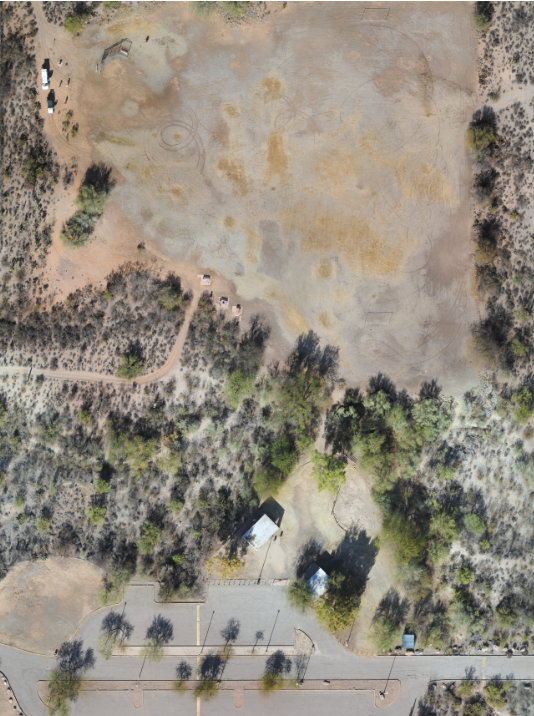
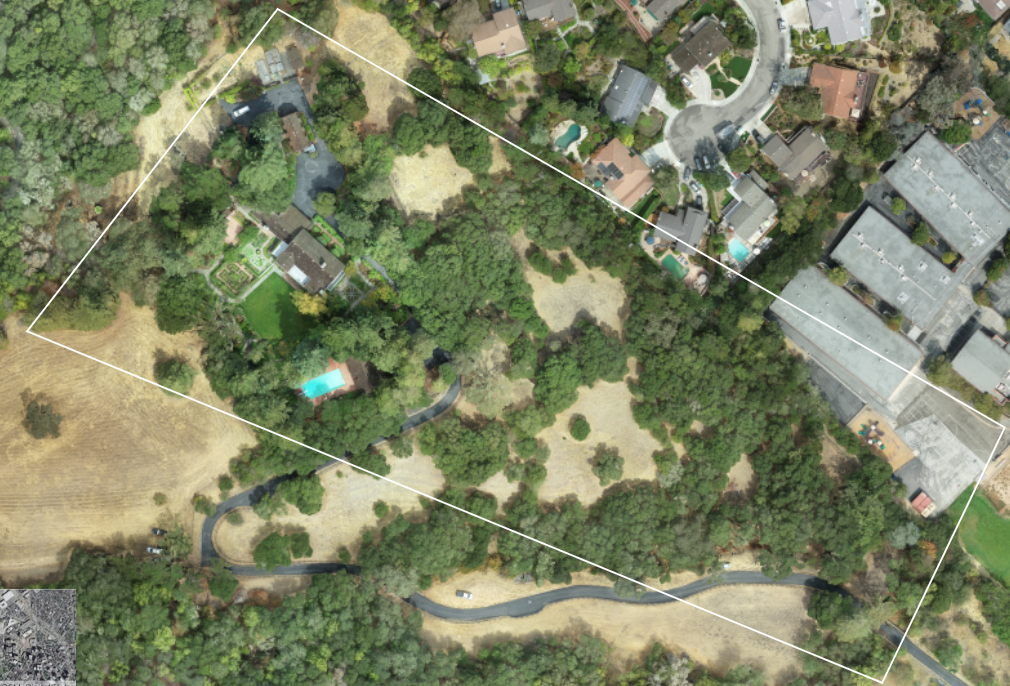
|
Normal Density Sites |
Low Density Sites |
|---|---|
|
|
Below we have outlined the cost associated with normal vs low density and how it correlates to acres.
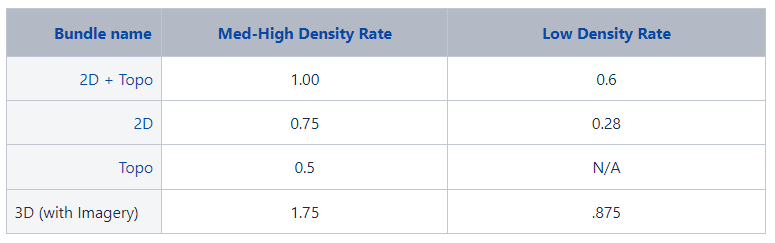
Note: The Topo only bundle does not have a density rate attached to it due to the complexity of point cloud segmentation that remains constant in terms of time needed to complete most projects.